Page 31 - Budget_2020
P. 31

Union Budget 2020


                                                     Key Statistics

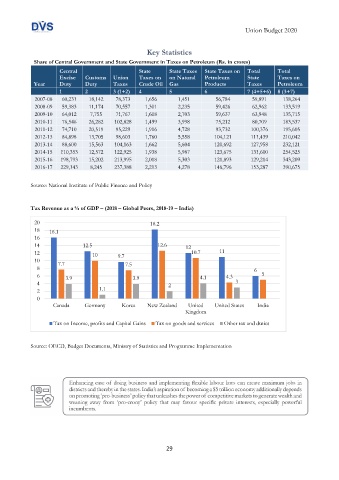
             Share of Central Government and State Government in Taxes on Petroleum (Rs. in crores)
                      Central                     State     State Taxes   State Taxes on   Total   Total
                      Excise   Customs  Union     Taxes on   on Natural   Petroleum     State      Taxes on
             Year     Duty     Duty      Taxes    Crude Oil  Gas         Products       Taxes      Petroleum
                      1        2         3 (1+2)   4        5            6              7 (4+5+6)  8 (3+7)
             2007-08   60,231   18,142    78,373    1,656       1,451        56,784       59,891    138,264
             2008-09   59,383   11,174    70,557    1,301       2,235        59,426       62,962    133,519
             2009-10   64,012    7,755    71,767    1,608       2,703        59,637       63,948    135,715
             2010-11   76,546   26,282   102,828    1,499       3,998        75,212       80,709    183,537
             2011-12   74,710   20,519    95,229    1,916       4,728        93,732      100,376    195,605
             2012-13   84,898   13,705    98,603    1,760       5,558       104,121      111,439    210,042
             2013-14   88,600   15,563   104,163    1,662       5,604       120,692      127,958    232,121
             2014-15   110,353   12,572   122,925   1,938       5,987       123,675      131,600    254,525
             2015-16   198,793   15,202   213,995   2,018       5,303       121,893      129,214    343,209
             2016-17   229,143   8,245   237,388    2,213       4,278       146,796      153,287    390,675


            Source: National Institute of Public Finance and Policy


            Tax Revenue as a % of GDP – (2018 – Global Peers, 2018-19 – India)
               20                                     18.2

              18  16.1
             16
               14             12.5                      12.6      12

               12                10       9.7                       10.7      11
             10
               8     7.7                     7.5                                          6

               6        3.9                     3.9                    4.1      4.3          5
              4                                             2                       3
               2                    1.1

               0
                    Canada     Germany      Korea    New Zealand   United   United States  India
                                                                  Kingdom
                    Tax on Income, profits and Capital Gains  Tax on goods and services  Other tax and duties


            Source: OECD, Budget Documents, Ministry of Statistics and Programme Implementation


                                                           29
   26   27   28   29   30   31   32   33   34   35   36