
Page 36 - Union Budget, 2022
P. 36
Union Budget, 2022
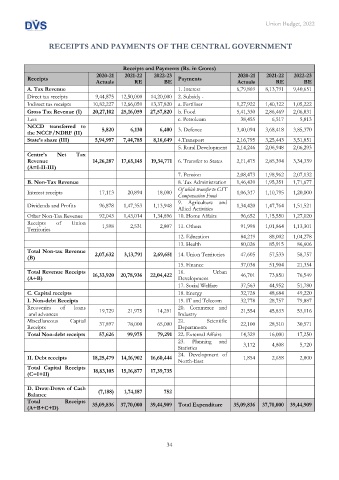
RECEIPTS AND PAYMENTS OF THE CENTRAL GOVERNMENT
Receipts and Payments (Rs. in Crores)
2020-21 2021-22 2022-23 2020-21 2021-22 2022-23
Receipts Payments
Actuals RE BE Actuals RE BE
A. Tax Revenue 1. Interest 6,79,869 8,13,791 9,40,651
Direct tax receipts 9,44,875 12,50,000 14,20,000 2. Subsidy -
Indirect tax receipts 10,82,227 12,66,059 13,37,820 a. Fertiliser 1,27,922 1,40,122 1,05,222
Gross Tax Revenue (I) 20,27,102 25,16,059 27,57,820 b. Food 5,41,330 2,86,469 2,06,831
Less: c. Petroleum 38,455 6,517 5,813
NCCD transferred to 5,820 6,130 6,400 3. Defence 3,40,094 3,68,418 3,85,370
the NCCF/NDRF (II)
State’s share (III) 5,94,997 7,44,785 8,16,649 4.Transport 2,16,795 3,25,443 3,51,851
5. Rural Development 2,14,246 2,06,948 2,06,293
Centre’s Net Tax
Revenue 14,26,287 17,65,145 19,34,771 6. Transfer to States 2,11,475 2,85,394 3,34,339
(A=I-II-III)
7. Pension 2,08,473 1,98,962 2,07,132
B. Non-Tax Revenue 8. Tax Administration 1,46,439 1,95,351 1,71,677
Of which transfer to GST
Interest receipts 17,113 20,894 18,000 Compensation Fund 1,06,317 1,10,795 1,20,000
9. Agriculture and
Dividends and Profits 96,878 1,47,353 1,13,948 Allied Activities 1,34,420 1,47,764 1,51,521
Other Non-Tax Revenue 92,043 1,43,014 1,34,896 10. Home Affairs 96,652 1,15,550 1,27,020
Receipts of Union
Territories 1,598 2,531 2,807 11. Others 91,998 1,01,864 1,13,301
12. Education 84,219 88,002 1,04,278
13. Health 80,026 85,915 86,606
Total Non-tax Revenue 2,07,632 3,13,791 2,69,651 14. Union Territories 47,605 57,533 58,757
(B)
15. Finance 37,038 51,904 21,354
Total Revenue Receipts 16. Urban
(A+B) 16,33,920 20,78,936 22,04,422 Development 46,701 73,850 76,549
17. Social Welfare 37,563 44,952 51,780
C. Capital receipts 18. Energy 32,728 48,684 49,220
I. Non-debt Receipts 19. IT and Telecom 32,778 28,757 79,887
Recoveries of loans 19,729 21,975 14,291 20. Commerce and 21,554 45,833 53,116
and advances Industry
Miscellaneous Capital 37,897 78,000 65,000 21. Scientific 22,100 28,510 30,571
Receipts Departments
Total Non-debt receipts 57,626 99,975 79,291 22. External Affairs 14,329 16,000 17,250
23. Planning and 3,172 4,808 5,720
Statistics
24. Development of
II. Debt receipts 18,25,479 14,16,902 16,60,444 North-East 1,854 2,658 2,800
Total Capital Receipts
(C=I+II) 18,83,105 15,16,877 17,39,735
D. Draw-Down of Cash
Balance (7,188) 1,74,187 752
Total Receipts
(A+B+C+D) 35,09,836 37,70,000 39,44,909 Total Expenditure 35,09,836 37,70,000 39,44,909
34